
Here are some pictures related to today’s classroom experiment on atomic line spectra. All the pictures were made by putting a pair of our diffraction grating glasses in front of the lens of a digital camera, then cropping out most of the image so that we can clearly see the pattern of colors produced by each light. These should be a close approximation to the patterns you saw yourself in today’s class, although the camera had trouble recording some of the purple part of the spectra. Like in class, you can see the original color of light in the center, and the component colors on the left and right sides.
First up is a continuous spectrum, made using the same light bulb we used today. To make the spectrum look more similar to the spectrum tubes, I put a piece of cardboard with a vertical slit in front of the light.
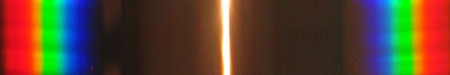 The colors of the rainbow are visible, and you see a smooth transition from color to color. Compare this to the next spectrum, gaseous helium.
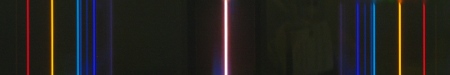 There are distinct lines in this atomic line spectrum, and only certain colors are emitted. Compare this pattern to hydrogen vapor.
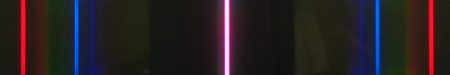 … which shows a distinctly different color pattern, even though the hydrogen gas and helium gas lamps look somewhat similar in color when viewed without the diffraction grating glasses. Now, take a look at neon gas (as in a traditional neon sign).
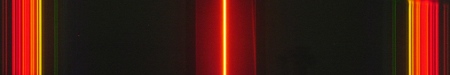 Neon gives a pattern distinct from the other elements tested so far. On to mercury (same as you’d find in a mercury vapor streetlight).
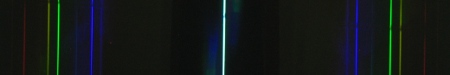
Like the other elements, mercury gives a distinct pattern of lines. As we discussed, every element has a distinct atomic line spectrum, and these spectra helped scientists figure out the structure of the electron cloud.