Illustration 1 - Phase diagram for water
Introduction
We have simple equations that tell us about the properties of a gas - the empirical gas laws. We don't have simple equations for the properties of most liquids or solids. We also don't have simple equations that tell us at what conditions a material may be a solid liquid or gas. The way you handle and store materials depends on what state the material is in - solid, liquid, or gas. We need some easy way to find out what phase a material would be in at whatever conditions we want to work in.
Empirical data
In general, there's no simple way to find out what phase a material is in at given conditions without doing an experiment. So, we have to rely on experimental data. For most common substances, this data has been tabulated previously by other researchers. The issue we have to deal with is that the amount of data is huge! How do we present it in a manageable form?
The phase diagram
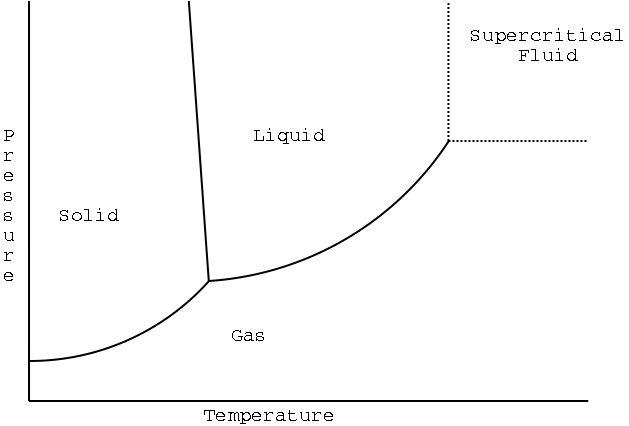
If we're merely interested in what form a substance is in at a given temperature (and where phase transitions occur), it's convenient to represent all that data using a phase diagram. The phase diagram shows what phase a substance is in at given conditions. It's convenient for most purposes to use a phase diagram that shows pressure versus temperature. (Pressure is on the 'y' axis, and temperature is on the 'x' axis.)
A phase diagram for water is shown below:
|
|
|
Illustration 1 - Phase diagram for water |
Notes on the diagram:
The curves/lines on the diagram represent phase transitions. For example, the line between solid and liquid represents freezing or melting (depending on how you change temperature or pressure).
The point where all three curves come together is called the triple point. The triple point is a set of conditions where solid, liquid, and gas can coexist at equilibrium. That is, all six phase changes occur at the triple point at the same rate.
The curve for vaporization/condensation just ends. This end point is called the critical point, and is the most extreme set of conditions where the gas and liquid phases are distinctly different.
The region of the plot between the dotted lines is the supercritical fluid state. Supercritical fluids combine some of the unique properties of solids and liquids.
We can also make a few observations about water:
At moderate pressures and low temperatures, water is a solid.
At moderate to high temperatures and low pressures, water is a gas.
At intermediate temperatures and intermediate pressures, water is a liquid.
According to the melting/freezing line, if you take solid water near the freezing point and compress it hard enough (increase the pressure), you can make it change into a liquid. This is unusual behavior, and it stems from the (also unusual) fact that solid ice is less dense than water. Think about how this behavior might benefit an ice skater.
More on the critical point
The critical point is probably new to you. At high pressures and temperatures, you have molecules moving fast (high temperature) - but at the same time, these molecules are close together (high pressure). At these conditions, you have neither a true gas nor a true liquid. You have something with the free-flowing properties of the gas, but the density of the liquid. This kind of substance is called a supercritical fluid .
There are two terms related to the critical point that you should know. One is the critical temperature. The critical temperature is the temperature past which, no matter what the pressure, the liquid state of the substance no longer exists. This is essentially the temperature coordinate of the critical point. The other term is the critical pressure. The critical pressure can be defined as the pressure necessary to liquefy a gas at the critical temperature. It is the pressure coordinate of the critical point.
Supercritical fluids are important in industry because they provide environmentally friendly solvents. Supercritical carbon dioxide, for example, is used in the decaffeination of coffee beans. Caffeine dissolves in supercritical CO 2 . Once the caffeine has been separated from the beans, t he pressure is lowered. The CO 2 escapes as a gas, while the caffeine (a solid at room temperature and pressure) remains behind. The advantage of this procedure is that there's no hazardous solvent waste.
Summary
The phase diagram lets us tell what phase a substance primarily exists in at a given pressure and temperature. The phase diagram also gives us information about phase changes - much more so than the "boiling point" or "freezing point" (which are really the boiling and freezing temperature at 1 atm pressure!) At extreme temperatures and pressures, a substance exists as a supercritical fluid, with properties of both liquids and gases.
You should be able to label a phase diagram, point out the critical point and triple point, and indicate phase transitions.
All original site content ©2007 Charles Taylor. Page updated: December 12, 2007.